SCADA system for visualization of production lines and machines
Web-based SCADA architecture for visualization of production data
Design of modern web applications for processing and displaying data collected on the production line or machines. Design of databases and their export to desired files.
IoT integration and location-independent system monitoring
Our SCADA apps, which collect data from PLCs and process it on local servers, are a natural part of the IoT (Internet of Things) paradigm. By connecting sensors, actuators, and other devices to a central application, we enable real-time data collection, visualization, and analysis. Using web technologies, the same data and system monitoring are available on any device – from desktop computers to tablets and smartphones – without the need for additional installations. This approach allows simultaneous access and management from multiple locations, optimizing production processes, enabling predictive maintenance, and supporting faster, data-driven decisions. The combination of IoT and web platforms ensures maximum flexibility, transparency, and efficiency in managing production systems.
Technologies used for visualization
Frontend: HTML, CSS, JavaScript, React Backend: ASP.NET Core (Web API, NVC), C#, MS SQL, My SQL
List of completed projects
The following is a brief overview of several realized SCADA visualization projects.
Web app for parcel locker management
The IoT solution via a web application enables full control and monitoring of the parcel locker. Through communication between the web application, the server computer, and the PLC, real-time two-way data flow is achieved. Users can check the status of each compartment, open or lock doors, and monitor all performed actions – all operations are automatically logged on the server computer. Web access allows viewing and managing the parcel locker from multiple devices without additional installations, increasing flexibility and data availability. The combination of IoT technology and web platform provides a transparent, secure, and efficient system for monitoring and managing the parcel locker while enabling detailed analysis of activity and operational optimization.
parcel locker home pageparcel locker settings
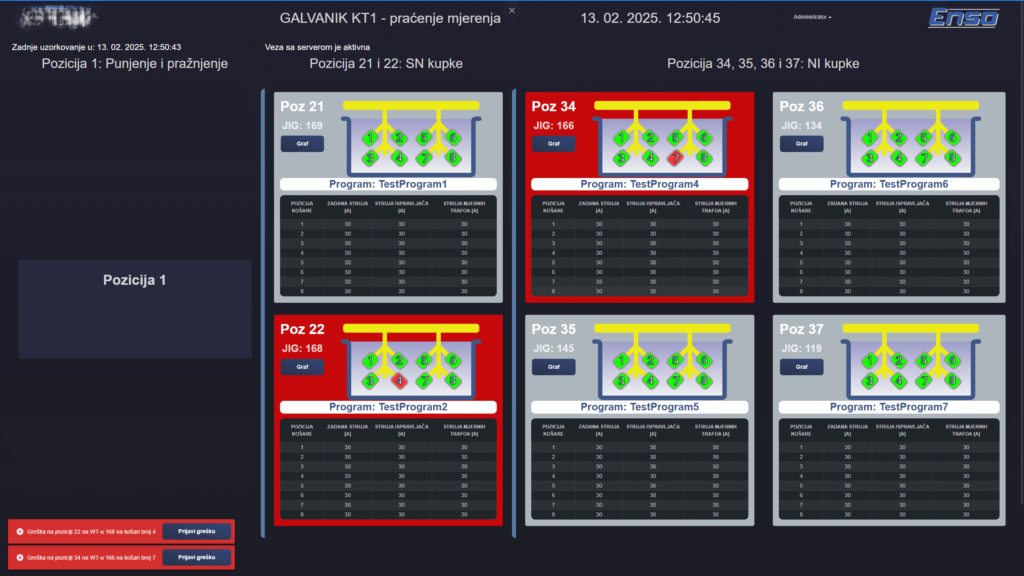
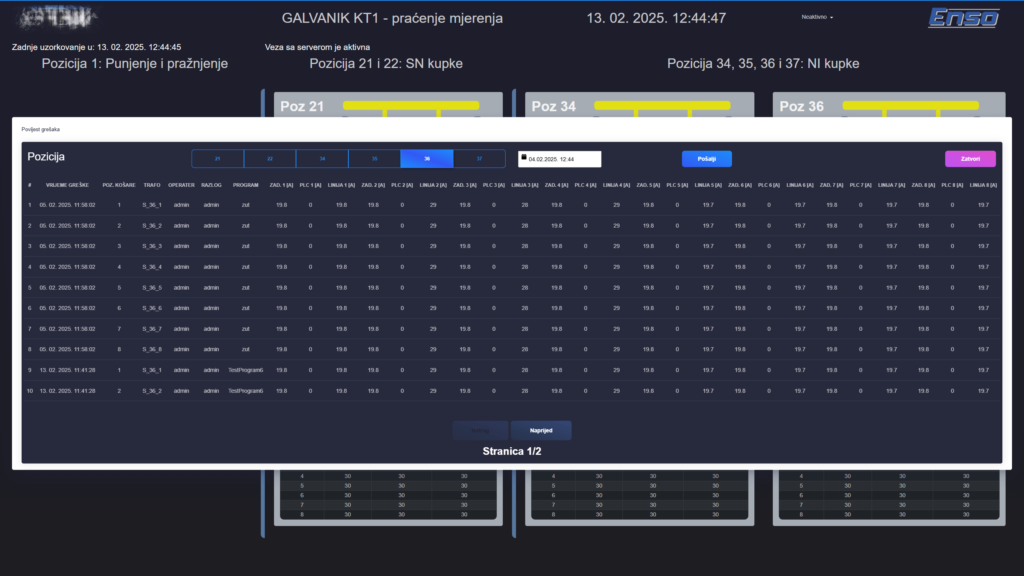
Monitoring galvanization current measurements
REACT SCADA aplikacija za prikaz podataka prikupljenih s lokalnih PLCa. PLC skuplja mjerene veličine sa strujnih transformatora u kadicama za galvanizaciju. PLC šalje podatke na server, gdje se oni obrađuju i poslužuju na web aplikaciju.
Aplikacija sadrži:
graph generation
user login/logout
CRUD for operator list, errors
settings
table view of error histor
error reporting
Current measurement web application error displayCurrent measurement web application table error history
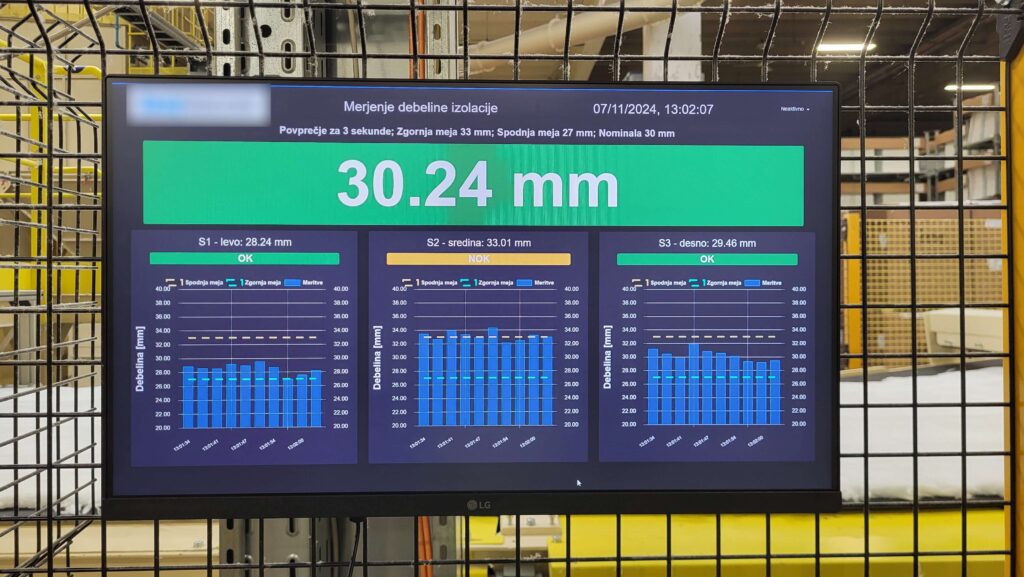
Measuring tracking
REACT SCADA application for displaying data collected from a local PLC. The PLC communicates with the server that serves the data to the web application. Measurements are exported to an easily accessible file on your computer.
SCADA web application for displaying measurements
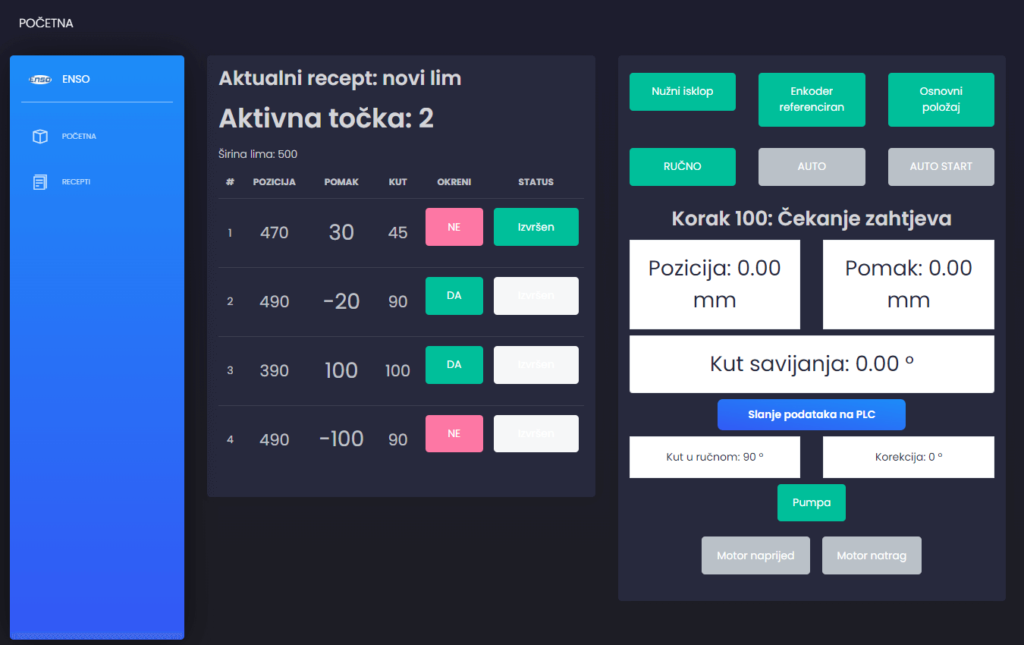
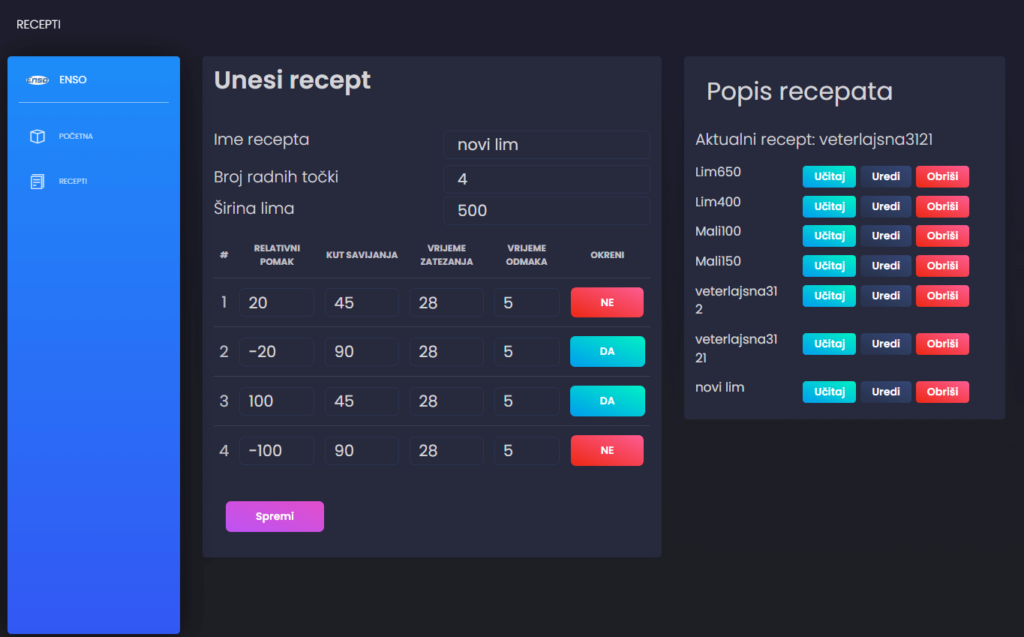
Application for monitoring the machine and recipes management
REACT machine state monitoring and recipe management (CRUD) application. Recipes are saved in the database on the server. The PLC communicates with the server.
SCADA web application for machine monitoringSCADA web application for recipe management
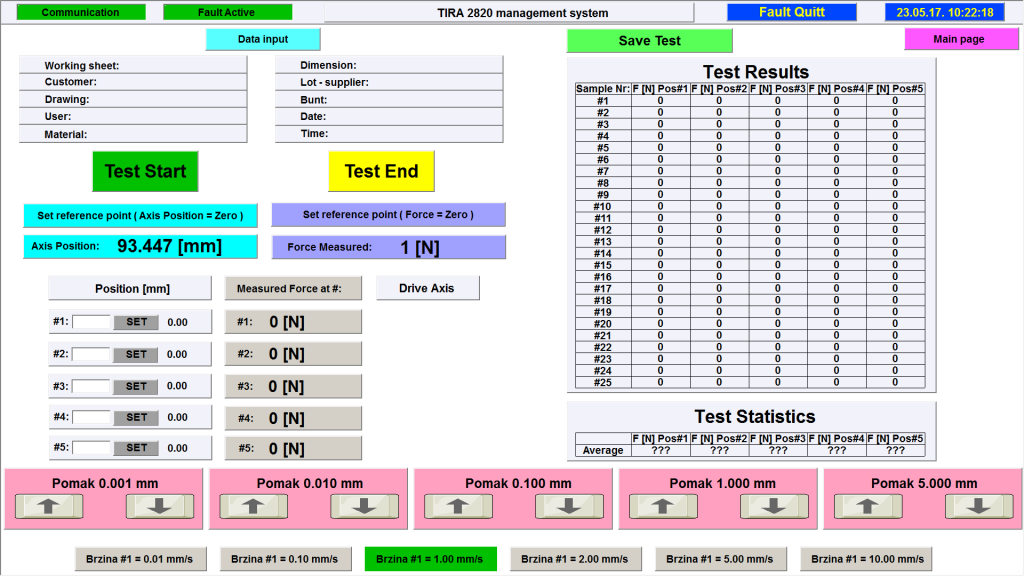
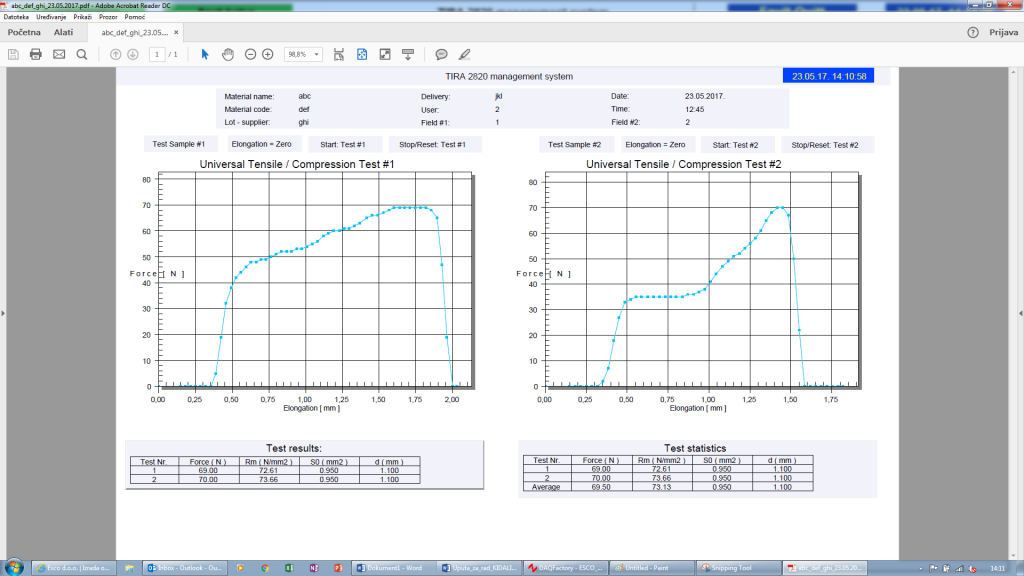
Ripper device control
With the reconstruction of the ripper, a system was developed that manages and monitors the machine itself via the DaqFactory (SCADA) application. The application displays the current force and position. The position of the ripper can be controlled via the application or by manual guidance with buttons. Two tests are present in the application, one for material tearing and the other for spring testing.
SCADA force measurementSCADA force measurement
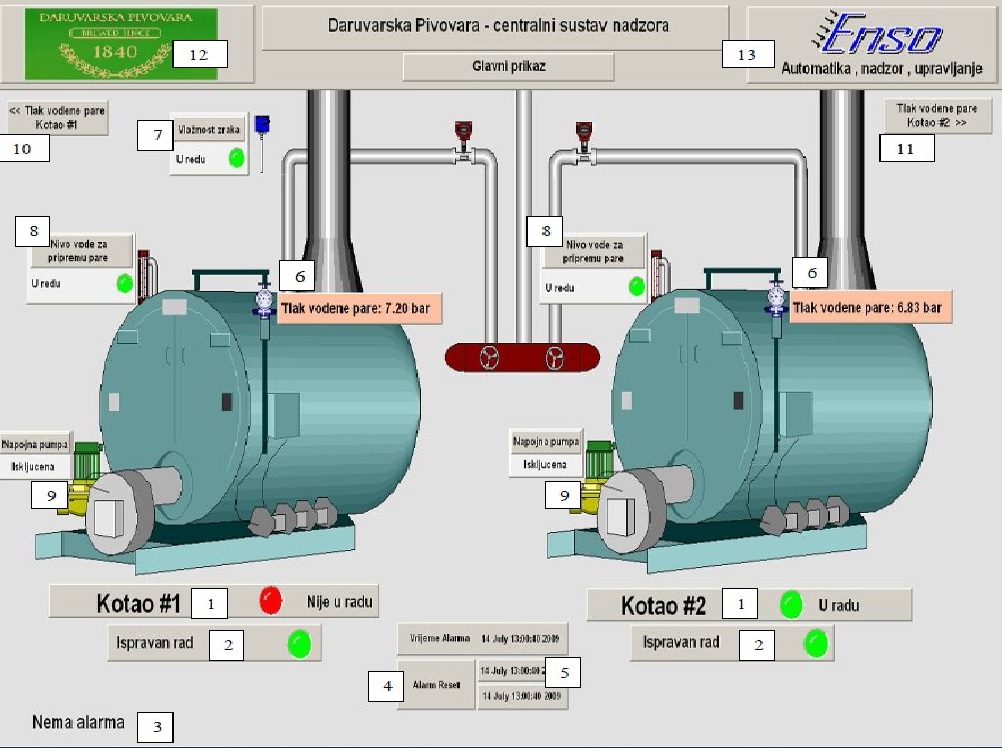
Visualization, signalling and monitoring the boiler room
The system is derived with RTU (Remote Terminal Unit) modules for the collection of analogue and digital signals, which via Ethernet communicate with SCADA application for visualization and monitoring operation parameter values of boilers. Water vapour pressure of each boiler (pressure transducer for high temperature) is measured, water level in preparation of water vapour, activity of feed pumps, proper operation of boilers ..
Visulalization brewery
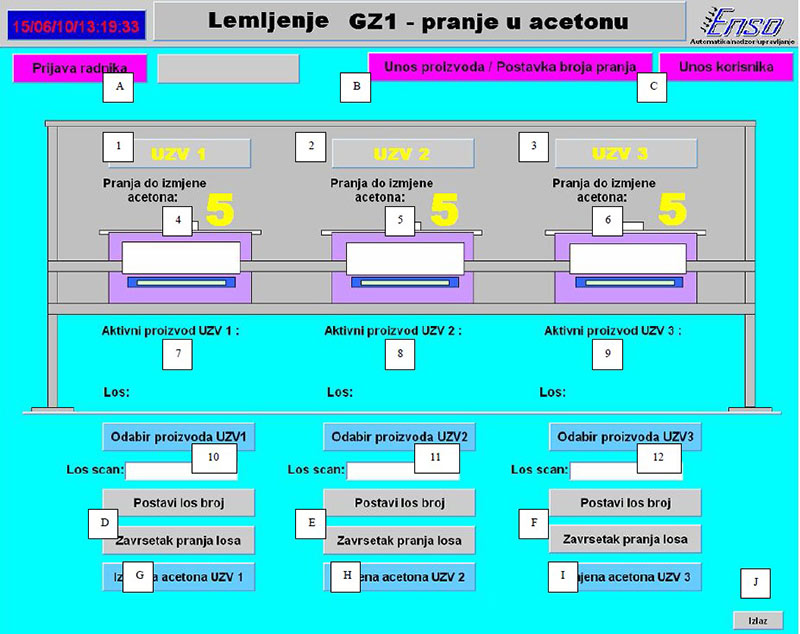
The system of measuring time washing in ultrasonic baths, data processing and visualization
Measuring of washing cycle time due to special conditions is derived indirectly by measuring the mass of an ultrasonic bath. RTU (Remote Terminal Unit) modules collect signals from the probes, and via RS-485 and Modbus protocol communicate with SCADA application. SCADA performs visualization, processing and storage of the collected data, alarm signalling errors and unauthorized state.
SCADA for aceton waching line
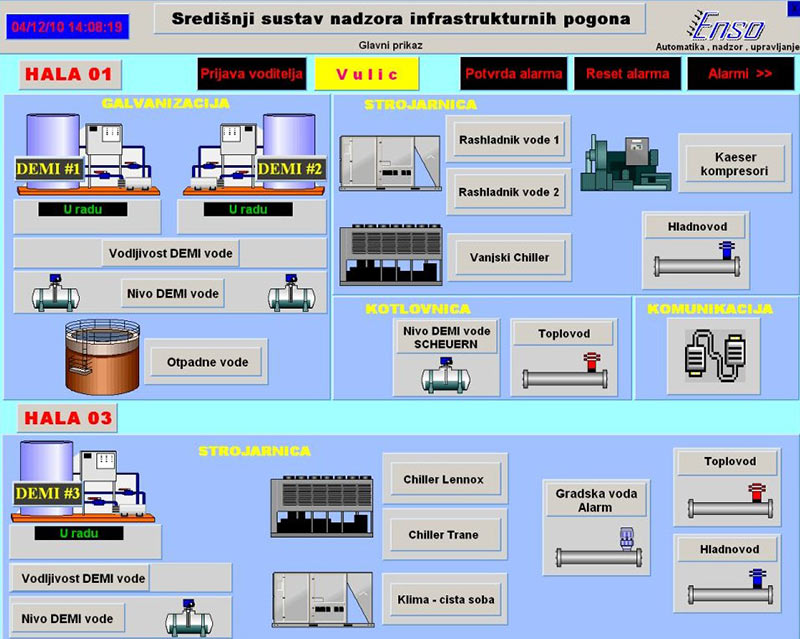
Infrastructure monitoring, recording and processing of data, alarms, “Mail to SMS”
Control of infrastructure size, error messages, records alarm… Using an existing Ethernet infrastructure Modbus TCP-IP. Control of boiler, wastewater treatment, air conditioners, compressor stations, demineralization plant, plant for the preparation of cold and hot water.
SCADA for lin infrastructure surveillance
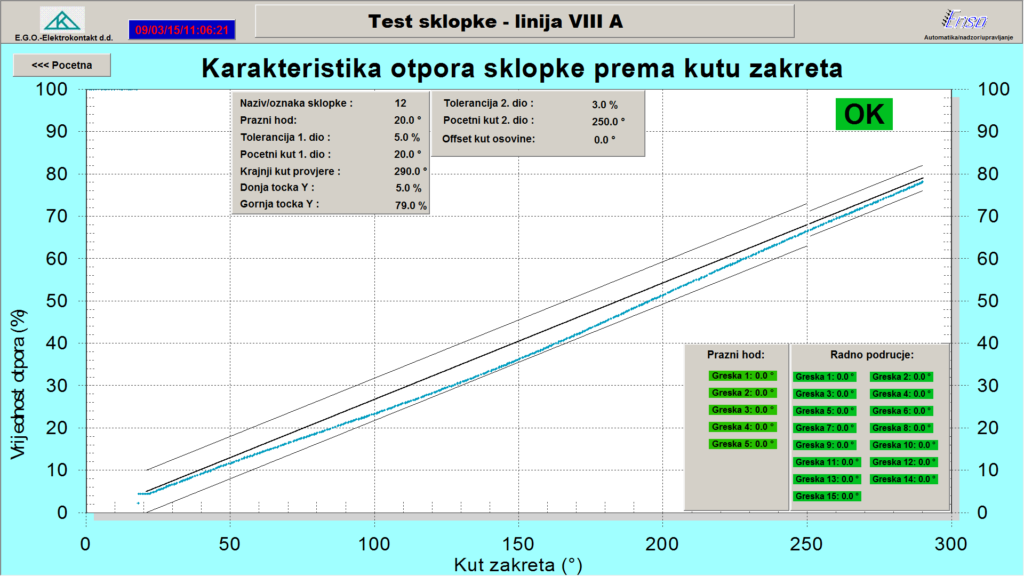
Monitoring and control of the analog / stepped couplings
Monitoring and control is performed by PLC series S7-1214 and application DaqFactory. By using the control switches the necessary data is sent to PLC, which receives data and drives the measurement program until other recipes is defined. Application for the supervision us also shows that the test switch is correct or incorrect, and if defective in which part of the switch is a failure.
SCADA for monitoring switch resistance characteristics